Measurements
Five Genome-mode tools return numbers: genome_describe_viewport, genome_signal_stats, genome_call_peaks, genome_quantify_at_features and genome_correlate_tracks. They are simple and transparent by design. This page gives their exact algorithms so you can check a result and know what it can and cannot mean. Parameters are listed in the Tool reference.
Where the numbers come from
All five tools read the tracks listed in the project's stored browser state, through the backend. They read the data files, not the rendered image:
- bigWig signal: the file's stored intervals (chromosome, start, end, value) that overlap the scope, at full resolution.
- bedGraph signal: lines from a tabix-indexed file, or from the whole text file when there is no index, that overlap the scope.
- bigBed, RepeatMasker and BED intervals: the features that overlap the scope. Result files written by Genie (such as peak BED files) are read from disk.
For genomes whose chromosomes are named without the chr prefix, the prefix is removed before querying; a track's ensemblStyle option overrides this.
An interval that overlaps the edge of the scope is counted with its full length in the summary statistics and in peak calling. The correlation and quantification tools count only the part that overlaps each bin or feature.
Viewport summary and signal statistics
genome_describe_viewport summarizes every track (or the listed trackIds) over the stored view region. genome_signal_stats computes the same signal statistics over a scope ("viewport", "chromosome", "all") or a list of regions, for signal tracks only.
For a signal track, with fetched intervals i of length L(i) = end − start and value s(i):
min            = smallest s(i)
max            = largest s(i)
sum            = Σ s(i) × L(i)
coveredBases   = Σ L(i)
mean           = sum / coveredBases          (length-weighted, over covered bases only)
nIntervals     = number of fetched intervals
coveredFraction = min(1, coveredBases / scope length)
Bases with no interval are left out of the mean rather than counted as zero. Because intervals at the edges are counted whole, coveredBases can exceed the scope length, which is why coveredFraction is capped at 1.
For an interval track (bigBed, BED, RepeatMasker and similar), the viewport summary reports featureCount (features overlapping the view), minScore and maxScore. Gene annotation, VCF, BAM, Hi-C and other track types return "no numeric summary".
Worked example (MYC demonstration). After loading ENCODE file ENCFF381NDD (K562 H3K27ac, fold change over control) on chr8:127,700,000-127,760,000, the viewport summary reported a maximum of 19.957429885864258 (shown as 19.96), a length-weighted mean of 1.14 and a minimum of 0 for the signal track, and 167 features for RepeatMasker.
The citation token that genome_describe_viewport returns points to a record holding only the locus, not the statistics. To check a viewport number, expand the tool card and read the result JSON. genome_signal_stats with scope: "viewport" gives the same signal statistics with a citation record that holds them.
Threshold peak calls
genome_call_peaks makes exploratory threshold calls on one signal track:
- Fetch the track's intervals over the scope (viewport by default).
- From the value of every fetched interval, one value per interval and not weighted by width, compute the mean and the sample standard deviation (n − 1).
- Set the cutoff:
method: "zscore"(default): cutoff = mean + k × SD, with k =threshold(default 2);method: "threshold": cutoff =thresholdas an absolute value (default: the mean).
- Keep intervals whose value is at or above the cutoff.
- Sort them and merge intervals that overlap or touch; a merged interval takes the largest value.
- Drop merged intervals shorter than
minWidth(default 1 bp). - Write a BED file (chr, start, end,
peak_<i>, score) togenome/results/and add it to the browser as a new track.
The result's threshold field is the absolute cutoff actually used, whichever method you chose, and the result carries the note "Simple z-score threshold caller over fetched intervals; not a model-based peak caller." There is no control track, no p-value or FDR, and no blacklist filtering.
Because the mean and SD in step 2 are unweighted, the cutoff cannot be reproduced from the length-weighted mean that the viewport summary reports. The cutoff is also relative to the window: the same signal can pass in one window and fail in another.
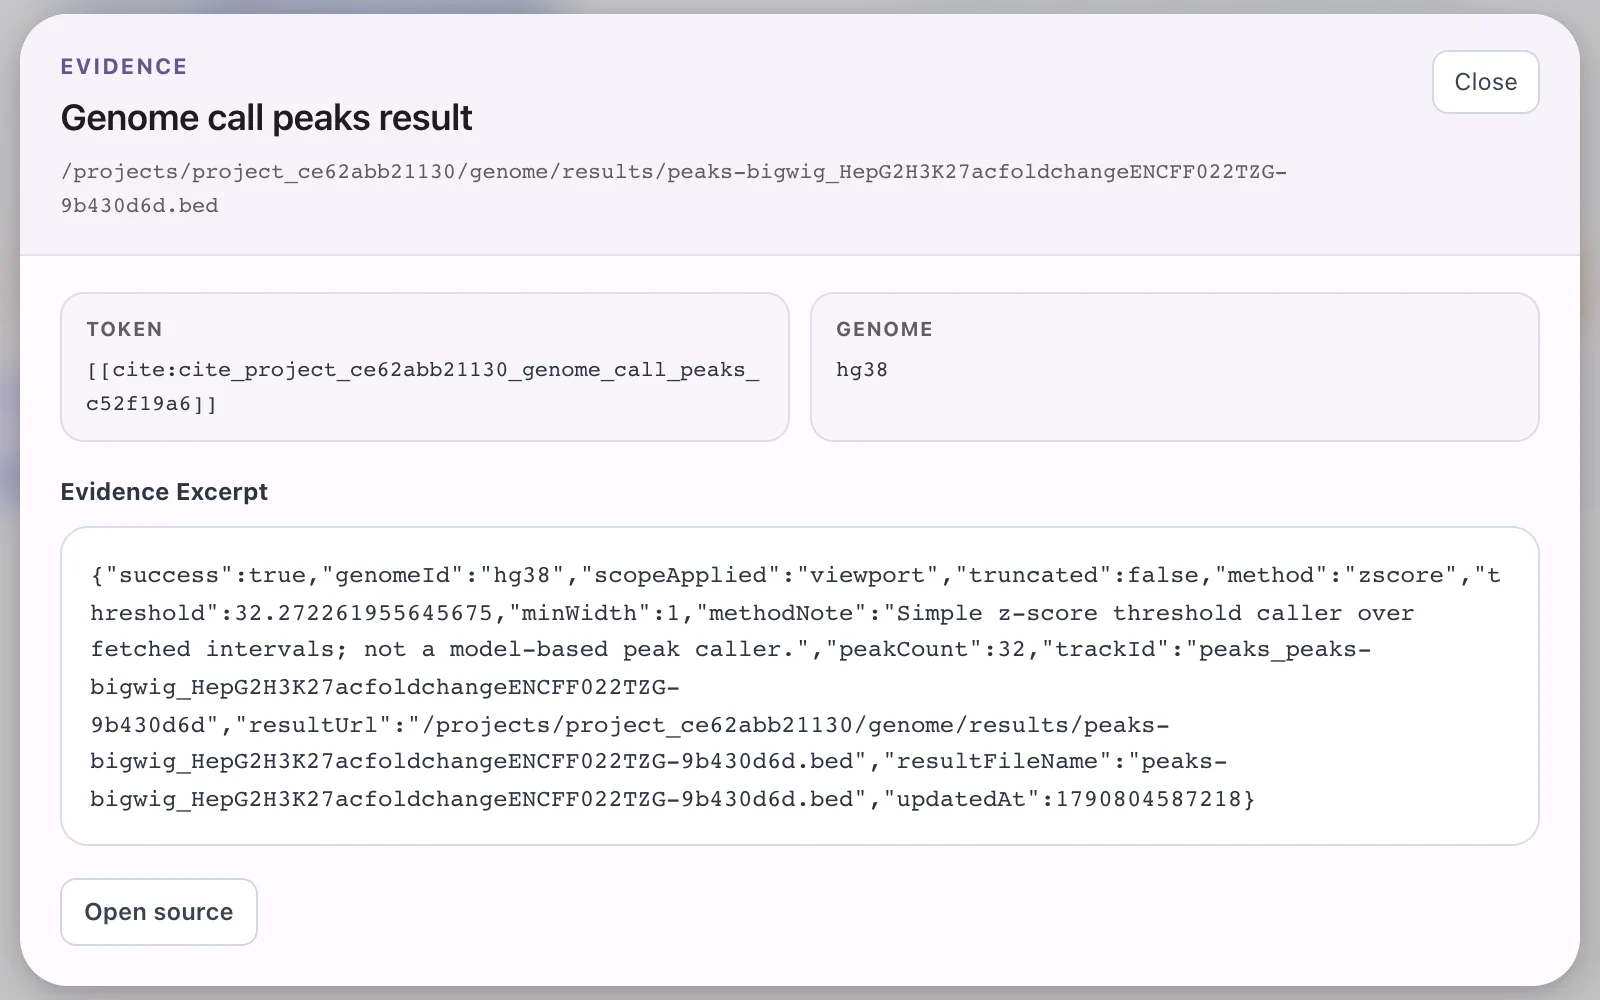
The citation record of a peak call on the HepG2 H3K27ac track in the ALB demonstration. The threshold field is the absolute cutoff.
Peak counts are fragment counts
Only intervals that overlap or touch are merged, and the minimum width is 1 bp. bigWig signal often dips below the cutoff for a few bases inside an enriched region, so one enriched region is usually reported as several intervals, some only 1 to 3 bp wide. Do not read peakCount as a number of elements.
To count regions, group the intervals yourself. The worked examples on this page group intervals separated by gaps of up to 1 kb; this is a display choice, and the count changes with the grouping distance.
Worked example (MYC demonstration). The z-score caller used a cutoff of 8.791333735783212 (shown as 8.79), which is the mean plus 2 SD of the fetched interval values. It returned 7 intervals, all within chr8:127,735,502-127,736,913 (about 1.4 kb). With 1 kb grouping they form one region; with 500 bp grouping, two (the largest gap is 513 bp).
Worked example (ALB demonstration). The HepG2 track gave 32 intervals (cutoff 32.27) and the K562 track 4 (cutoff 4.06). With 1 kb grouping that is about 4 regions in HepG2 and 1 in K562 (about 0.8 kb, near 73.45 Mb). Eleven of the 32 HepG2 intervals are 3 bp or shorter, and six are 1 bp. "32 peaks versus 4" is not a comparison of element counts, and peak counts are not a differential-enrichment test.
Quantification at features
genome_quantify_at_features summarizes one signal track over each feature of an interval track (for example the peak BED written by genome_call_peaks) within the scope. For each feature, using every signal interval that overlaps it and the overlap length O:
mean = Σ s × O / Σ O      (overlap-weighted; empty if nothing overlaps)
sum  = Σ s × O
max  = largest s among overlapping intervals
Features are ranked by the chosen metric, highest first (features with no value last), and written to a TSV with the header rank chr start end name featureScore <metric>. The call returns the top topN rows (default 20, at most 100). The TSV is not added as a track. Built-in gene annotation tracks cannot be used as feature tracks.
Binned correlation
genome_correlate_tracks computes a binned Pearson correlation between two signal tracks:
- Split the scope into bins of
binSizebp. If not set, binSize = max(100, ceil(scope length / 500)), which gives about 500 bins for scopes of 50 kb or more. The last bin of a scope can be shorter. - For each bin and track, compute the coverage-weighted mean of the intervals that overlap the bin, over the bases they cover. Uncovered bases inside a partly covered bin are left out of the mean; a bin with no coverage is 0.
- Compute Pearson's r over the bins, every bin with equal weight. If either track has zero variance across bins, r is
null.
The tool returns r, nBins and binSize. It does not check that the two tracks come from comparable assays or output types, and it does not normalize them.
Worked example (ALB demonstration). The window chr4:73,380,000-73,460,000 is 80 kb, so the default bin size is ceil(80,000 / 500) = 160 bp and there are 500 bins. Binned Pearson r between the HepG2 and K562 H3K27ac fold-change tracks was 0.0022: no linear correlation in this window. That value does not measure tissue specificity.
r depends on the bin size and is not an agreement measure
- Bin size changes r. In the GATA1 test session (K562 H3K27ac against DNase-seq over a 70 kb window), the tool reported r = 0.330 at its default 140 bp bins. A post-hoc recomputation in the same window gave 0.309 at 50 bp, 0.510 at 500 bp, 0.846 at 1 kb and 0.875 at 2 kb bins; Spearman's rho was 0.642. The sign was stable, positive under every variant tested; the size was not.
- r is not a calibrated measure of agreement. There is no reference value for agreement at one locus, and a few bins at one strong locus can dominate r. Report r together with its bin size, and do not describe one window's r as "agreement".
- Check what you are correlating. The search may have relaxed the output type (in the GATA1 session the DNase-seq track was read-depth normalized signal, not fold change over control). See Public data search.
No significance testing
Genie computes no p-values, confidence intervals or error control. r is reported without a significance test, and peak calls are exploratory threshold calls. A standard test that treats the bins as independent would be badly overconfident: in the GATA1 window, neighbouring 140 bp bins had lag-1 autocorrelations of 0.875 (H3K27ac) and 0.869 (DNase-seq), an effective sample size of about 68 to 80 of the 500 bins.
The 5 Mb scope limit
genome_signal_stats, genome_call_peaks, genome_quantify_at_features and genome_correlate_tracks refuse any scope whose total length is more than 5,000,000 bp. They do not fail outright; they return:
{
  "success": false,
  "error": "scope too large for synchronous analysis (<n> bp > 5000000 bp); narrow the region or use viewport scope",
  "scopeApplied": "chromosome",
  "truncated": true
}
where <n> is the total number of bases in the requested scope. The computation tools still issue a citation for this result, and its excerpt is the failure.
On hg38 every chromosome except chrM is longer than 5 Mb, so scope: "chromosome" and scope: "all" fail in practice. Use the viewport, or list explicit regions (for genome_signal_stats) that add up to 5 Mb or less. There are no background jobs and no cancellation for longer computations.
genome_describe_viewport has no such check. If the view is wider than 5 Mb, each signal track's entry contains the error "scope too large for direct signal fetch (<n> bp > 5000000 bp); narrow the region or use viewport scope." while the call as a whole reports success. Interval tracks are still counted.
Reading the numbers
| Result | Read it as | Do not read it as |
|---|---|---|
| Viewport or scope mean | Length-weighted mean over covered bases | A mean that counts gaps as zero |
peakCount | Number of merged intervals at or above a window-relative cutoff | Number of regulatory elements or peaks from a model-based caller |
| No peak called | Signal below this window's cutoff | Absence of the mark |
| Correlation r | Binned Pearson r at one bin size in one window | Agreement, tissue specificity, or a tested association |
| Quantification rank | Order of features by one metric | Functional importance |
These tools measure; they do not interpret. In logged test sessions, the agent gave correct numbers followed by unsupported inferences, and read tool artifacts (such as 1 bp intervals) as biology. Check the agent's wording against the result JSON. See Citations and evidence and Limitations and known issues.